# The Whole code is generated by Claude

"""
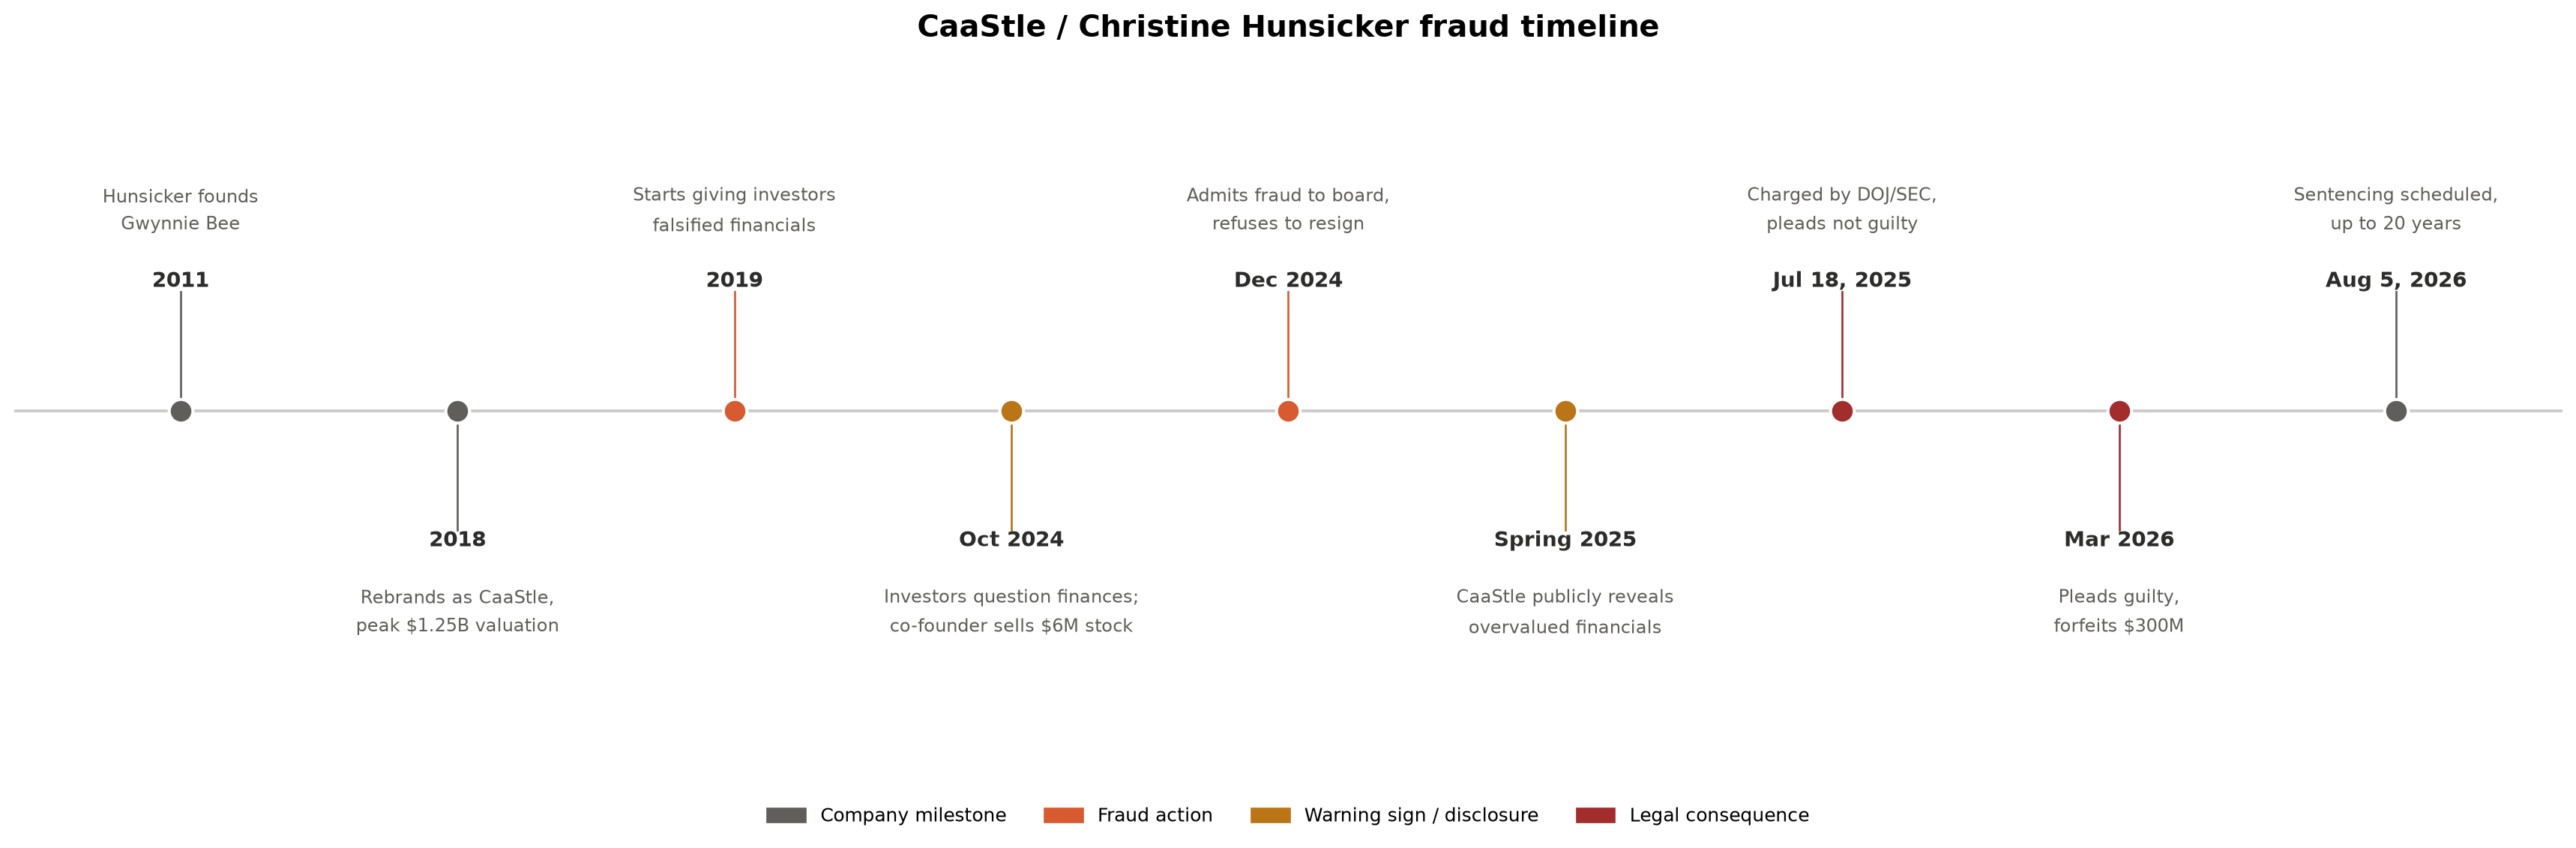
Horizontal timeline chart of the CaaStle / Christine Hunsicker fraud case.
Requires only matplotlib: pip install matplotlib
"""

import matplotlib.pyplot as plt
import matplotlib.patches as mpatches

# --- Event data: (date label, short description, category) -----------------
# Swap this list out for your own events to reuse the chart for anything else.
events = [
    ("2011",         "Hunsicker founds\nGwynnie Bee",                 "milestone"),
    ("2018",         "Rebrands as CaaStle,\npeak $1.25B valuation",   "milestone"),
    ("2019",         "Starts giving investors\nfalsified financials","fraud"),
    ("Oct 2024",     "Investors question finances;\nco-founder sells $6M stock", "warning"),
    ("Dec 2024",     "Admits fraud to board,\nrefuses to resign",     "fraud"),
    ("Spring 2025",  "CaaStle publicly reveals\novervalued financials","warning"),
    ("Jul 18, 2025", "Charged by DOJ/SEC,\npleads not guilty",        "legal"),
    ("Mar 2026",     "Pleads guilty,\nforfeits $300M",                "legal"),
    ("Aug 5, 2026",  "Sentencing scheduled,\nup to 20 years",         "milestone"),
]

# --- Category -> color and legend label --------------------------------------
colors = {
    "milestone": "#5f5e5a",  # gray
    "fraud":     "#d85a30",  # coral
    "warning":   "#ba7517",  # amber
    "legal":     "#a32d2d",  # red
}
legend_labels = {
    "milestone": "Company milestone",
    "fraud":     "Fraud action",
    "warning":   "Warning sign / disclosure",
    "legal":     "Legal consequence",
}

# --- Build the figure ----------------------------------------------------------
n = len(events)
fig, ax = plt.subplots(figsize=(18, 6))

# the horizontal spine all markers sit on
ax.axhline(0, color="#cccccc", linewidth=1.5, zorder=1)

for i, (date, desc, cat) in enumerate(events):
    color = colors[cat]
    above = i % 2 == 0          # alternate labels above/below the line
    sign = 1 if above else -1
    va = "bottom" if above else "top"

    # connector from the spine up/down to the label
    ax.plot([i, i], [0, sign * 0.45], color=color, linewidth=1, zorder=2)

    # marker dot on the spine
    ax.scatter(i, 0, s=140, color=color, zorder=3, edgecolor="white", linewidth=1.5)

    # bold date label, closer to the line
    ax.text(i, sign * 0.45, date, ha="center", va=va,
             fontsize=10.5, fontweight="bold", color="#2c2c2a")

    # description, further from the line
    ax.text(i, sign * 0.65, desc, ha="center", va=va,
             fontsize=9, color="#5f5e5a", linespacing=1.6)

# --- Cosmetics -------------------------------------------------------------
ax.set_xlim(-0.6, n - 0.4)
ax.set_ylim(-1.3, 1.3)
ax.axis("off")
ax.set_title("CaaStle / Christine Hunsicker fraud timeline",
             fontsize=15, fontweight="bold", pad=15)

handles = [mpatches.Patch(color=c, label=legend_labels[k]) for k, c in colors.items()]
ax.legend(handles=handles, loc="upper center", bbox_to_anchor=(0.5, -0.05),
          ncol=4, frameon=False, fontsize=9.5)

plt.tight_layout()
# plt.savefig("caastle_timeline.png", dpi=200, bbox_inches="tight")
plt.show()